
Norbert's
… BUBBLEGUM v.2 CODE for two-channel resonance scattering
Disclaimer: this code has no "background terms" as the author does
not believe in abstract and incoherent background, which is normally
added to improve the resonance fit. This problem is under investigation.
The present code focuses on unitarity, analyticity, and form factors.
The FORTRAN code BUBBLEGUM.f
calculates the unitary, analytic
T-matrix for a two-channel
problem with an arbitrary number of resonances. It also gives
the approximate results from the K-matrix method, the Breit-Wigner
approximation, or the perturbative method for the same problem.
The FORTRAN code EPLOT.f generates a standard eps
figure "plot.eps"
from the data
files generated by BUBBLEGUM.f.
It allows one to include and exclude
certain data files.
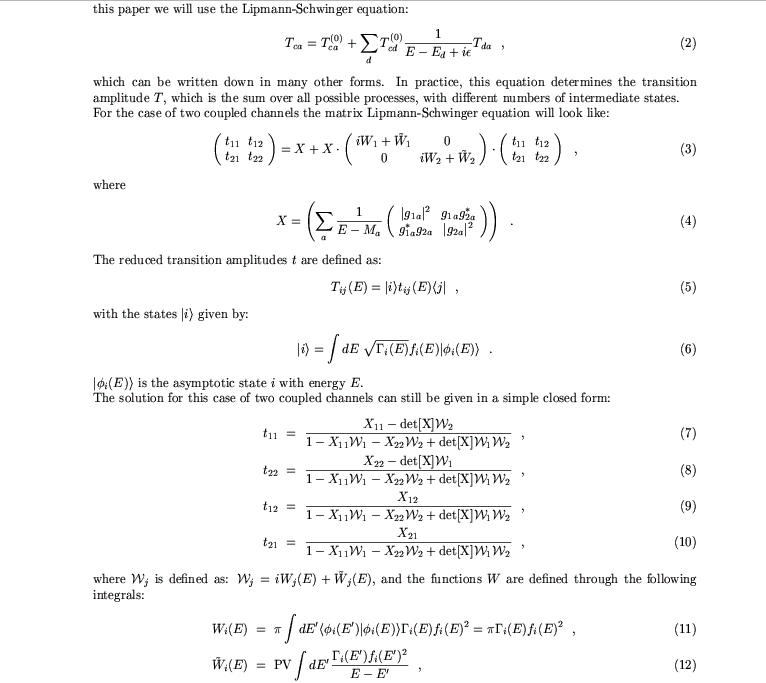
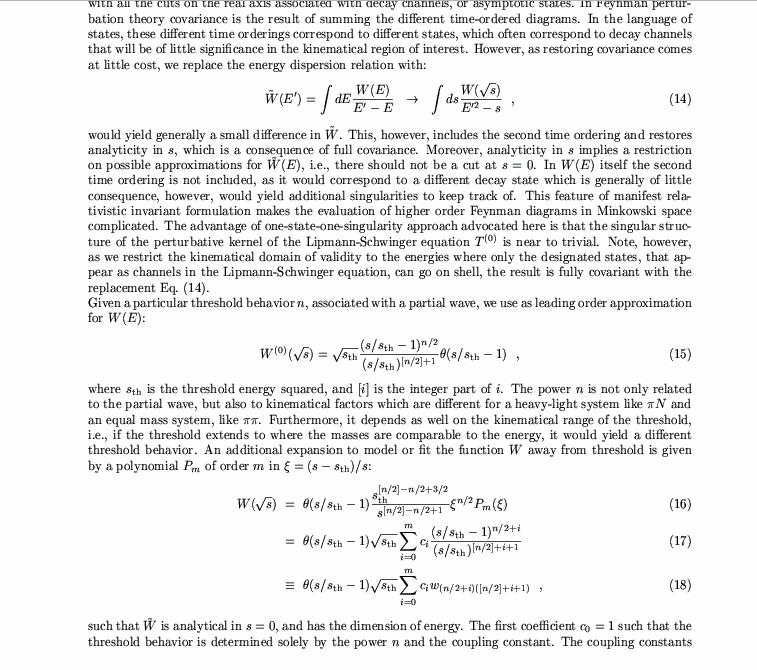
The Coherent Bubble Sum Approximation (hence the name "bubblegum")
which is used to determine the
exact T-matrix is explained in the paper
bubblegum.ps
(bubblegum.pdf).
Three key features of bubblegum, which are absent in most coupled
channel codes:
ANALYTICITY AND UNITARITY
MASS SHIFTS DIRECTLY CORRELATED WITH THE HADRONIC FORM FACTORS
EXPANSION FOR THE FORM FACTORS; ALLOWS ONE TO FIT THE
FORM FACTORS FROM THE DATA
Version 2 attempts global mass shifts for the resonances, such
that the T-matrix results and the approximate results compare
better. However, for large values of the coupling constants,
i.e., greater than 0.3, such a global mass shift might not
exists. The program signals such failure, and will use unshifted
values in that case.
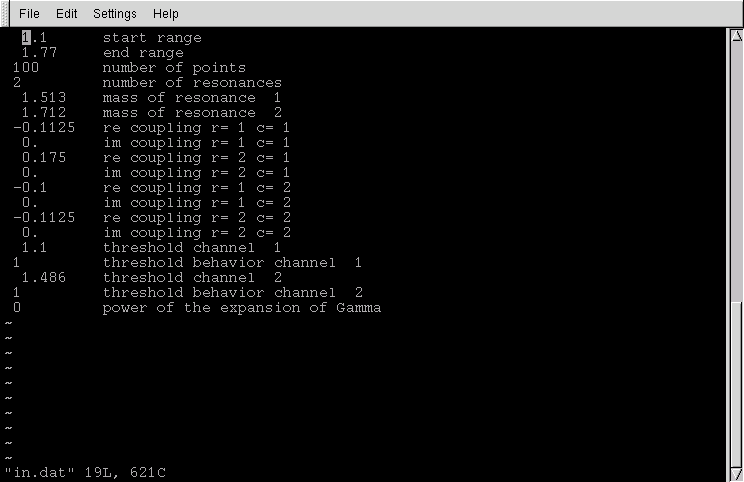
An example input file "in.dat"
with two resonances. The general layout of the input file
with an arbitary number of resonances and an arbitrary expansion
is given in "template.in.dat"
The example is taken from the S11 channel.
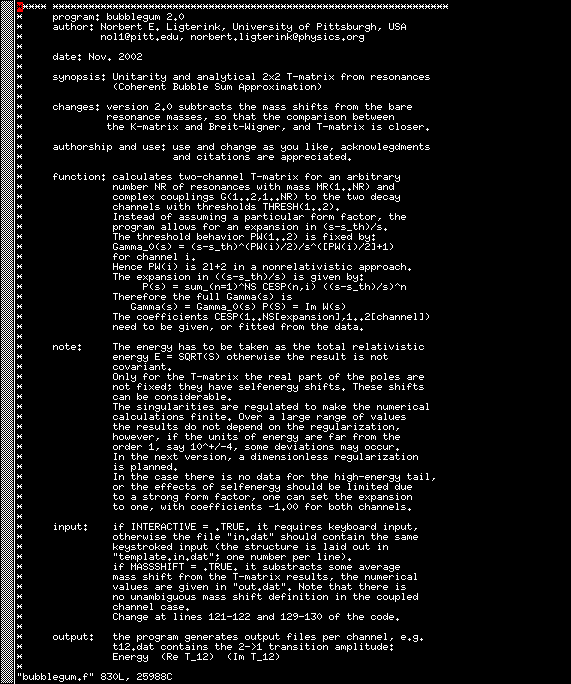
The first comment lines of the BUBBLEGUM.f.
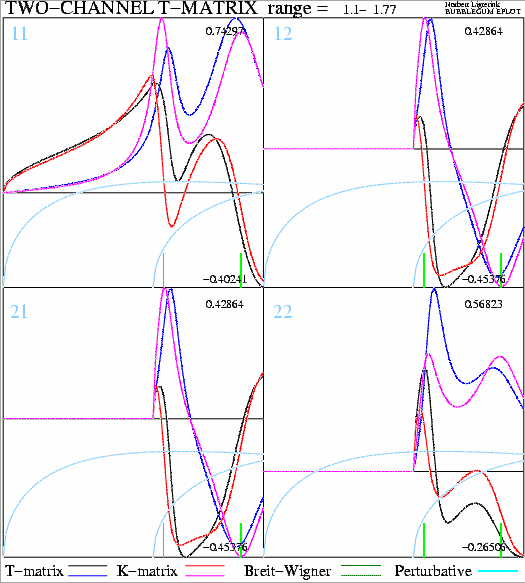
The output of EPLOT.f: "plot.eps", plotting "11100"
which means T-matrix and
K-matrix results. The green vertical lines indicate the position of the
bare resonances. The light-blue lines at the bottom are the normalized
Gamma, or W,
functions of each channel. The numbers in the corner are the maximum
and minimum value in each channel (single channel unitarity restricts
the real part from
-0.5 to 0.5, and the imaginary part from 0.0 to 1.0 (the Argand circle)).
The horizontal
black line is the zero axis. The Breit-Wigner and the perturbative
results are not plotted here, but can be plotted with "11111". The
program has no other options on purpose. For more elaborate plotting
use your own favorite plotting program. The output files:
t11.dat, t12.dat, t21.dat, t22.dat, k11.dat, k12.dat, k21.dat, k22.dat,
b11.dat, b12.dat, b21.dat, b22.dat, p11.dat, p12.dat, p21.dat, p22.dat,
gamma1.dat, and gamma2.dat contain all the BUBBLEGUM.f output information,
which is required for EPLOT.f, together with the BUBBLEGUM.f
input file in.dat.
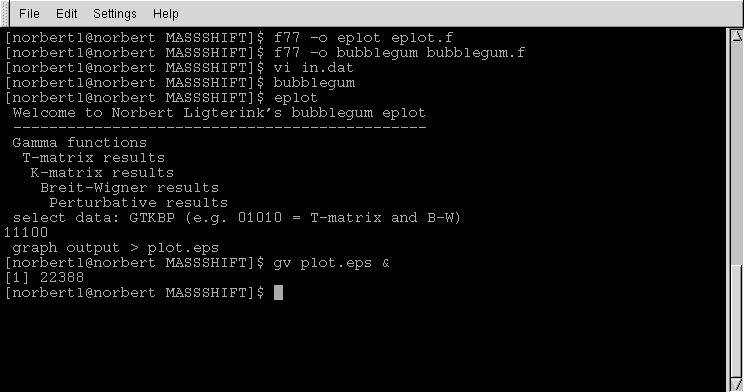
Below a little shell window, with all the commands required to
generate some output:
Some of the main formulas of the bubblegum approximation:
Any problems compiling: (I used GNU Fortran 0.5.26 20000731
(Red Hat Linux 7.1 2.96-85)), please send me the log file.
Any problems running, please send me the input file, and the
error message.


